DrumPlot 3.2
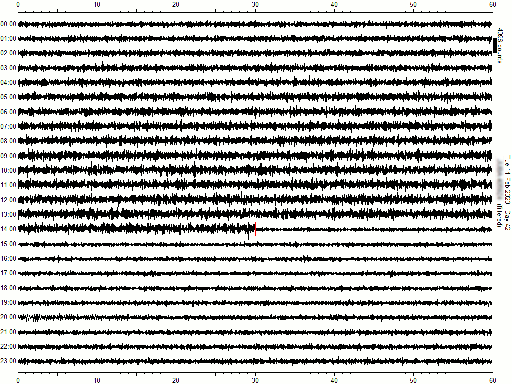
DrumPlot is a display and printing utility which presents seismic data as a
series of images, creating one page (or set of pages) at regular intervals,
configurable between one every ten minutes and one every 24 hours. The data are
drawn in 24 rows of one hour each, with a red cursor indicating the last update,
as in the sample shown below (click for a full-resolution
version):

DrumPlot receives the data by listening on a network port, and creating a 24
hour buffer for each stream received. In this way, it can be an ‘add-on’ for
Scream!, offering an alternative output type.
Two output options are available: page print or PNG image generation.
As many streams as desired can be selected independently for printing or image
generation. A printout of is automatically generated at midnight UTC, and the PNG
images are generated at 00:00 and 12:00 UTC (configurable – see
below). An optional post-processor allows
user-controlled handling of the generated PNG images (e.g.
transferring them via FTP to a web server).
Download
If you have installed Scream, DrumPlot will have been
installed as part of the Scream installation. You may still wish to use the
links below if you do not have the latest version.
DrumPlot v3.2 for Windows (332 K .zip)
This windows binary uses the QT runtime
DLL
file
qtintf70.dll. This is normally installed with
Scream but, if it is not installed on your system, you will receive an
error message when you try to run this software. You can download this DLL
from
here. It should be placed
either in the same directory as the program or in the
system32 directory.
or
DrumPlot v3.2 for Linux (373 K .gz)
This linux binary needs access to the
Qt runtime library
(a 2.4 M
.gz), either in your
normal library path or in the current directory.
If the library cannot be loaded, the following error is displayed:
Runtime error 230 at 080677E9
Segmentation fault (core dumped)
This 32-bit linux software runs on 32-bit and 64-bit
operating systems. To install it on a 64-bit Linux platform, please follow
these instructions
to install the relevant libraries.
The program is self contained and stand-alone. It does not need any explicit
installation, and can be run "as is". (The Linux version is delivered in gzip
format so the command gunzip DrumPlot.gz should be
run after downloading the file.)
Installation
The DrumPlot executable can be placed anywhere but a reasonable choice is to
place it in the same directory as Scream:
C:\Program Files (x86)\Guralp Systems\Scream4.6\
under Windows or
/usr/lib/Scream4.6/
under Linux.
The program creates configuration and data buffer files in the directory
from which it is started. This should not normally be the
same location as the executable file. If DrumPlot is used to print
.png image files, these are also created in the
directory from which it is started. For this reason, it is recommended to
create a new directory to hold these files. The user who runs DrumPlot must
have permission to create files in this directory.
A number of operational parameters are set by means of command line options.
These are defined under "Usage", below.
-
Under Windows, an ideal place to specify the start-up folder and
the operational parameters is in the properties of a shortcut to DrumPlot. For
example, to auto-run DrumPlot at start-up (or login), place a shortcut to the
drumplot.exe file in the startup folder of the start
menu then edit the properties of this shortcut to specify the chosen start-up
folder and any needed parameters. (For instructions, please see
Creating a Windows
Shortcut for DrumPlot.exe.)
-
Under Linux, a good way to specify the start-up folder and the
operational parameters is in a shell script stored somewhere in your command
search path, such as /usr/local/bin/drumplot.
This file could contain:
#!/bin/sh
cd /var/drumplot-data
/usr/lib/Scream4.6/drumplot optional arguments here
You should then make the file executable with the command
chmod 755 /usr/local/bin/drumplot
See below for an explanation of the
possible arguments.
Usage
DrumPlot can obtain data to plot in two ways. It always listens on a
UDP port so, if you arrange Scream to send data to the correct port, DrumPlot
will automatically receive them. In addition, DrumPlot can be configured to
pull data over the network from a specified IP address and UDP port, given as
command-line options.
The network port that DrumPlot listens on is selected in the following
priority order:
-
The user specifies a command-line option as the port number to listen on.
For example: drumplot 1568
-
DrumPlot searches for a scream.ini file, and
uses the port number found there. If DrumPlot is run on the same PC as
Scream!, this option will auto-match the ports used by Scream! and DrumPlot.
-
The default port, 1567, will be used.
By default, Scream and DrumPlot will both try to listen
on port 1567 and the second program to be started will, therefore, fail. It is
recommended to use a different port for DrumPlot.
DrumPlot can also ‘pull’ data from one or more Scream! servers. To set up a
data pull, simply add a parameter to the command-line for each server, in the
form -s:a.a.a.a:p, where
a.a.a.a is the IP address of the Scream
server PC, and p is the port number that the
Scream server is listening on. For example, to request data from server
192.168.12.34, port 1567, you might use the command line
drumplot 1568 -s:192.168.12.34:1567
If you do not specify a "listening port" on the command
line, DrumPlot will try to listen on port 1567. This may cause a conflict if
Scream is running on the same PC. In such cases, it is recommended that a
"listening port" is specified, as above, even if unused.
The Main Screen
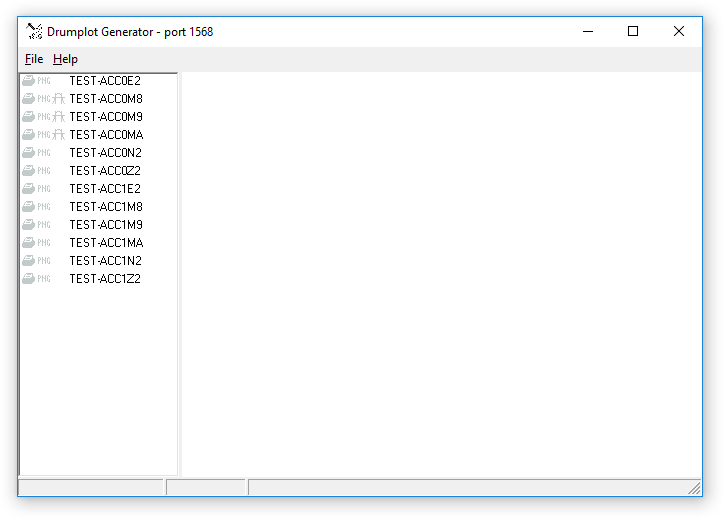
Once running, a window is displayed, which is divided into two areas: a
stream list on the left and a waveform display on the right (initially blank):

The program will pick up all streams from the listening port
and from any specified 'pull' sources. For each stream, an entry will be added
to the stream list, a buffer file will be created (in the directory from which
DrumPlot was started), and the data placed in the buffers.
In the stream list, streams are listed in alphabetical order. To the left of
each stream ID is a set of icons:
-
 The print icon is used to select streams which will be printed. It is shown in grey
by default to signify that the stream will not be printed.
If you click this icon, it will be shown in solid black and the stream
will be printed. Click again to toggle between the two states.
See Hard-copy printing below for more details.
-
 The PNG icon is used to select streams which will be used to generate image files.
It is shown in grey by default to signify that images will not be
generated for this stream. If you click this icon, it will be shown in solid
black and images will be generated. Click again to toggle
between the two states.
See ‘Printing’ to .png files
below for more details.
-
 The filter icon is only shown for 1 sample-per-second streams. Click to toggle
between solid black/red (filter on) and grey (filter off). When enabled, this
option applies a ten-second to thirty-second band-pass filter to the data. This
can be used to highlight any teleseismic events in the data.
The features of the main screen, once data are displayed, are shown below:

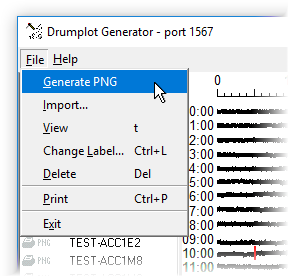
Menu options
Above the stream list is a menu.

The Menu options are:
-
–
immediately generate a PNG for the selected stream and invoke
the post-processor, if one has been
defined.
-
–
Import data from a GCF file into the buffer for the appropriate
stream, if it exists. A file selection dialogue is displayed from which one or
more files can be selected. This facility can be used to "pre-load" DrumPlot with
data.
Files imported in this way should contain twenty-four
hours (or less) of data from a single day – i.e they should not cross over a
midnight boundary.
- (or enter
or f5) – graphs the buffer associated with
the currently selected stream in the window. Double-clicking on a
file-name also performs this action.
-
(or ctrl + l)
– On the right-side of the printout (under the date and time), a user-specified
line of text is printed. This option allows the user to change this text as
desired.
-
(or del)
– Delete the reference and the file. If the stream is still being
transmitted by another program (eg Scream!), the stream will reappear. This can be used
to clean out old streams, or clear the buffer of an existing stream.
-
(or ctrl + p)
– Print the selected stream now.
-
– terminates the program. All data
will be saved in the buffer files in the program's working directory.
Command-line options
The program's behaviour is controlled by a number of command-line arguments,
described below.
Stream selection
If you wish to limit the number of streams displayed and, perhaps more
importantly, avoid having to provide buffer space for streams which you will
never print, you can provide a list of wanted streams as a command-line option.
Specifying
-A:StreamID-1,StreamID-2[,StreamID-n…]
will limit the streams displayed and buffered to only those in the supplied
comma-separated list.
Re-draw rate
By default, the on-screen display will refresh every minute with the
currently selected file. A red vertical marker indicates the current time (last
data received). Any gaps in the data are shown as blank spaces. To change the
one-minute default, use the command line option
-redraw:n
where n is the redraw rate
in seconds. A value of 0 will
cause DrumPlot to refresh the display every time a new block is received, which
is the default.
Hard-copy printing
To enable a stream for automatic printout (to the system's default printer)
at midnight, click the ‘print’ icon
( )
to the left of the stream-name. Any number of streams may be selected for
printing. A laser printer is recommended to achieve best resolution and
performance.
‘Printing’ to .png files
To enable a stream for automatic PNG image generation, click the ‘PNG’ icon
( )
to the left of the stream-name. Any number of streams may be selected for PNG
generation. If a post-processor has been installed (see
below) then it will be called when the PNG file is created.
The size of the images created are independent of the size of the window,
and can be controlled with command-line parameters
-imgX:x
and -imgY:y,
where x and y are the
width and height of the generated image, in pixels. For example, to generate
PNG images that are 640×480, use the command:
drumplot -imgX:640 -imgY:480
If you do not specify a size, the resulting images will be 512 pixels
wide and 400 pixels high.
Print frequency
By default, an image will be generated every 12 hours. To change this,
use the command line option
-genpng:n, where
n
is the interval between image generation in minutes. The valid range is from 10
minutes to 24 hours (1440 minutes).
Post-processing
To use the post-processor option for PNG images:
- under Windows, a program file called FTPfile.exe
should be placed in the same directory as DrumPlot.
- under Linux, a program file called ftpfile
should be placed anywhere in your search path, $PATH.
DrumPlot calls this program each time it generates a PNG image, passing the PNG
file-name as a parameter.
This program can be used for may different purposes. The most common application,
however, is to transfer the generated file to a web-server for display. A
sample Windows program to do this using FTP can be downloaded from
here. It consists of a program,
ftpfile.exe, and a template configuration file, ftpfile.ini.
Fill in the blanks in the configuration file to specify the FTP options.
The file ftpfile.ini should be placed in the
directory from which DrumPlot is started. The file
ftpfile.exe should be placed in the same directory as
DrumPlot.
Technical notes
Command-line options may be introduced with a minus sign
('-'), as in the examples above, or a solidus
('/'). Either may be used without affecting
the results.
The scale is automatically selected to adjust to the signal level, such that
most of the data are within the constraints of the strip. To prevent short
periods of large signal from forcing the rest of the data to a flat line, a
small percentage of ‘over-range’ data is allowed.
The amplitude scale is in counts, and represents the space between the
traces (i.e. 1/24 the height of the drawing
area).
The status bar below the file-list displays the sample-rate and file-size of
the currently selected file.
If there is insufficient disk space for the 24 hour buffer, the
stream-name will be displayed in gray and the output features will be
disabled. To re-enable, first free up sufficient disk space and then delete
the stream entry. A new buffer will be created when the next data are
received for that stream.
When run, DrumPlot creates buffer files in the directory from
which it was started. There should, therefore, be enough disk space for all
necessary buffering. As a guideline, each 4 sps stream will require
1.32 MB. A 100 sps stream would require approximately 33 MB.
Therefore a typical three component instrument with 3×100 sps and
3×4 sps would require a total of 103 MB.
For more information, first contact your
local distributor
or email .
![]() The print icon is used to select streams which will be printed. It is shown in grey
by default to signify that the stream will not be printed.
If you click this icon, it will be shown in solid black and the stream
will be printed. Click again to toggle between the two states.
See Hard-copy printing below for more details.
The print icon is used to select streams which will be printed. It is shown in grey
by default to signify that the stream will not be printed.
If you click this icon, it will be shown in solid black and the stream
will be printed. Click again to toggle between the two states.
See Hard-copy printing below for more details.![]() The PNG icon is used to select streams which will be used to generate image files.
It is shown in grey by default to signify that images will not be
generated for this stream. If you click this icon, it will be shown in solid
black and images will be generated. Click again to toggle
between the two states.
See ‘Printing’ to .png files
below for more details.
The PNG icon is used to select streams which will be used to generate image files.
It is shown in grey by default to signify that images will not be
generated for this stream. If you click this icon, it will be shown in solid
black and images will be generated. Click again to toggle
between the two states.
See ‘Printing’ to .png files
below for more details.![]() The filter icon is only shown for 1 sample-per-second streams. Click to toggle
between solid black/red (filter on) and grey (filter off). When enabled, this
option applies a ten-second to thirty-second band-pass filter to the data. This
can be used to highlight any teleseismic events in the data.
The filter icon is only shown for 1 sample-per-second streams. Click to toggle
between solid black/red (filter on) and grey (filter off). When enabled, this
option applies a ten-second to thirty-second band-pass filter to the data. This
can be used to highlight any teleseismic events in the data.


