Scream! 4.5 released
December 2010
Güralp Systems are delighted to announce the release of version 4.5 of Scream!, the leading software application for Seismometer Configuration, REaltime Acquisition and Monitoring. The new version offers improved spectrograms, integration with Google Maps/Google Earth and a host of other features.
Scream! 4.5 optionally includes version 3 of ART, Güralp Systems’ Analysis and Research Tool, a Windows program for processing and analysing strong motion records from Güralp Systems’ instruments. ART works closely with Scream! to make analysing seismic data easy. Scream!’s visualisation and filtering capabilities allow you to view time series and quickly identify events. Strong-motion records can then be directly imported into ART by selecting the appropriate portion of the record in Scream! and using the right-click context menu, which will automatically start ART with the selected data pre-loaded. Previously recorded data in Güralp Compressed Format (GCF) can also be read in from files and analysed with any of the rich selection of sophisticated processing techniques. Click here for more details about ART 3.
In common with previous releases, Version 4.5 will be offered as a free download. This release represents the culmination of nearly three years of development effort and incorporates support for newer GSL equipment as well as valuable suggestions from our customers. Existing Scream! users will be notified by email of the new release; new customers should send an email to for instructions for accessing the free download, stating any institutional affiliation and the type(s) of equipment with which the software will be used.
Highlights include:
- Improved performance when handling large numbers of network clients;
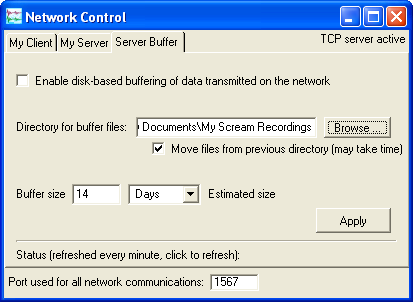
- Long-period back-fill for the real-time network protocol, configured via a new tab in the Network Control window (see screen-shot);
- Enhanced terminal emulation in the Terminal window, adding full support for configuring EAM acquisition modules as well as Y-modem file transfers;
- Enhanced WaveView windows, offering:
- re-boot indication marks;
- re-synchronisation indication marks;
- a selection of sort options for re-ordering streams;
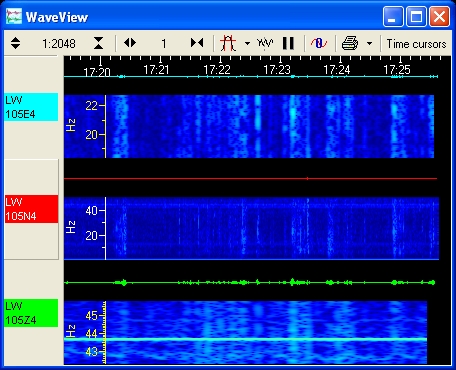
- enhanced spectrograms (see below);
- the ability to toggle all spectrograms simultaneously;
- a "scale-to-match" facility, to re-scale all streams to that selected, along with other new scaling options;
- the ability to toggle captions using a keyboard shortcut (F11);
- the ability to select regions of active WaveView windows without first having to pause; and
- direct access to calibration values from within the WaveView window.
- An "Explore Recording Folder" option on Windows to open a Windows Explorer in the recording folder for a stream;
- Automatic logging and continuous averaging of the Latitude and Longitude of sensors, as reported in their GPS data, including detection of when a sensor is moved;
- The plotting of sensors in Google Maps and the plotting of networks in Google Earth;
- New spectrogram features:
- major speed improvements resulting from a new, multi-threaded architecture;
- the ability to change size on a window-by-window basis;
- a new, labelled frequency axis; and
- the ability to zoom in on a frequency range of interest (hold Ctrl to apply to all streams in a WaveView).
- Direct access to the terminal emulator from the Setup → Com Ports dialogue by double-clicking the port;
- Improved support for modems and dial-up operation; and
- The ability to perform actions on multiple servers simultaneously from the Network Control window.
This is just a selection of the new features and facilities available in this exciting new version. Please see the release notes accompanying the package for further information.


